This chart from the OECD demonstrates how, across generations, education rates are changing. For many countries, the direction is strikingly positive; in others, change is harder to see.
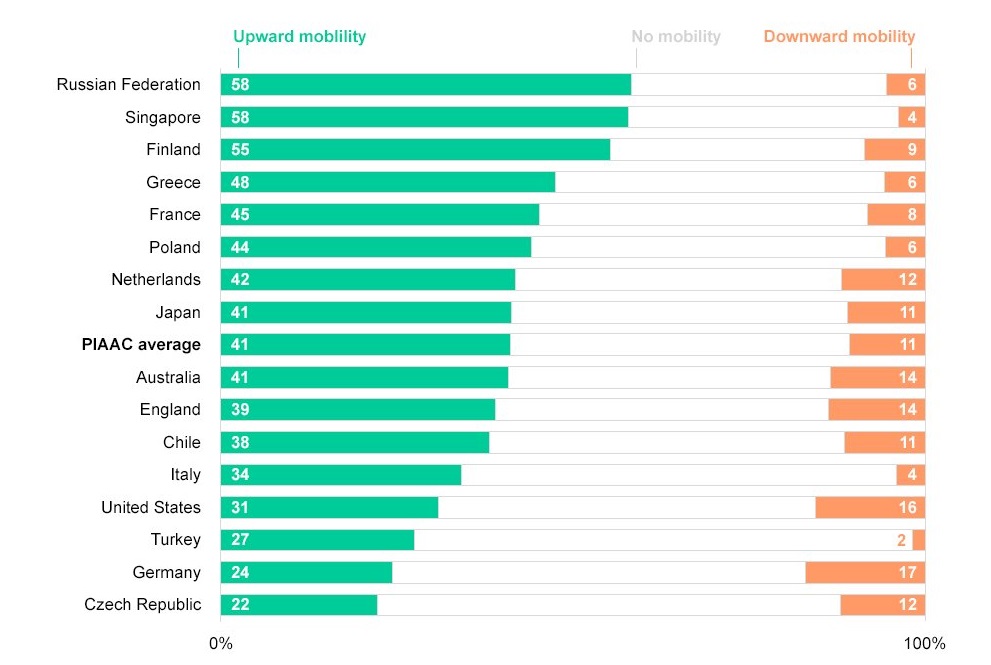
The graphic displays a selection of countries that participated in the Programme for the International Assessment of Adult Competencies. The average refers to all 33 participating countries
Source: OECD


 Receive the Funding Newswire [full access requires a subscription] each Tuesday, our Policy Bulletin each Thursday, and news about bridging Europe’s east-west innovation gap twice a month in The Widening.
 A unique international forum for public research organisations and companies to connect their external engagement with strategic interests around their R&D system.