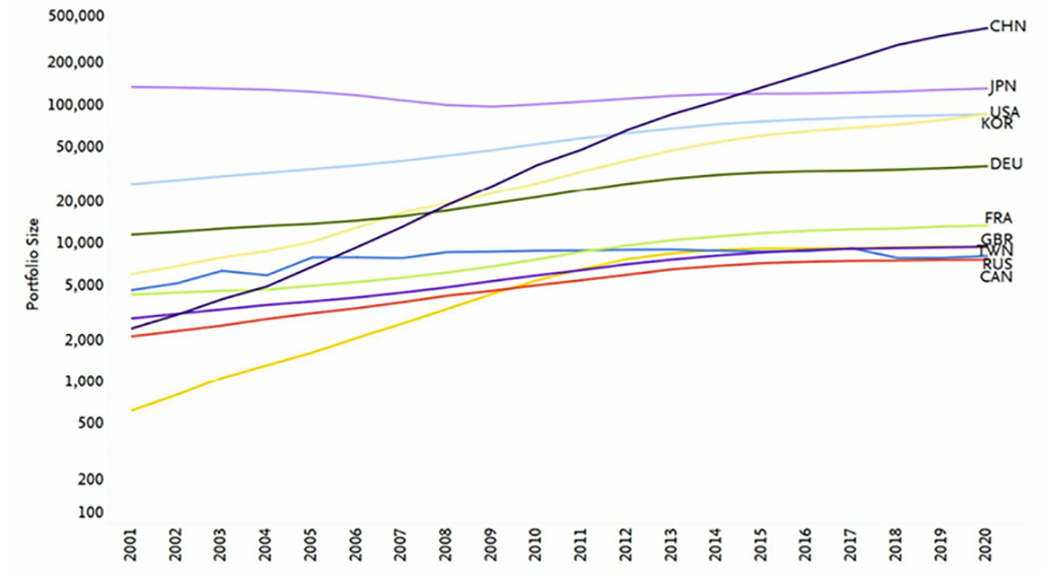
Number of net zero energy patents by country and region for the top 10 by portfolio size, 2001–2020. Portfolio size is in logarithmic scale and starts at 100. Data from LexisNexis PatentSight
Annual patent publications in net zero energy technologies have been growing exponentially since 2008, according to a new report by Elsevier.
According to the report, of the top ten countries and regions, China had the largest patent portfolio in carbon-free energy technologies by 2015, having surpassed the US in 2012 and Japan in 2014. By the end of 2020, almost half of all global active patents originated in China.
In total, active patents in net zero energy stood at 800,000 at the end of 2020, with the number published annually increasing to more than 100,000. The number of patents identified by the report started to grow exponentially in 2008, with the number of active patents tripling in just ten years.
The technology focus of the patent portfolios of Japan, the US, China, South Korea and Europe are strikingly different. While the US and Europe have quite similar shares of the major technology clusters, Japan has a much larger share in electronics, with almost two-thirds of its patents citing net zero energy publications. South Korea has a similar focus to Japan, with China falling somewhere in between the two.
“The [International Energy Agency] published a report earlier this year that showed that the growth in international patent families has been more than double for clean technologies generally, compared with those for fossil fuel technologies,” said Joan MacNaughton, the chair of the climate action organisation, Climate Group. “That’s quite a shift.”
In addition to leading in clean energy patents, China is also publishing almost 50% more research on the topic than any other country.
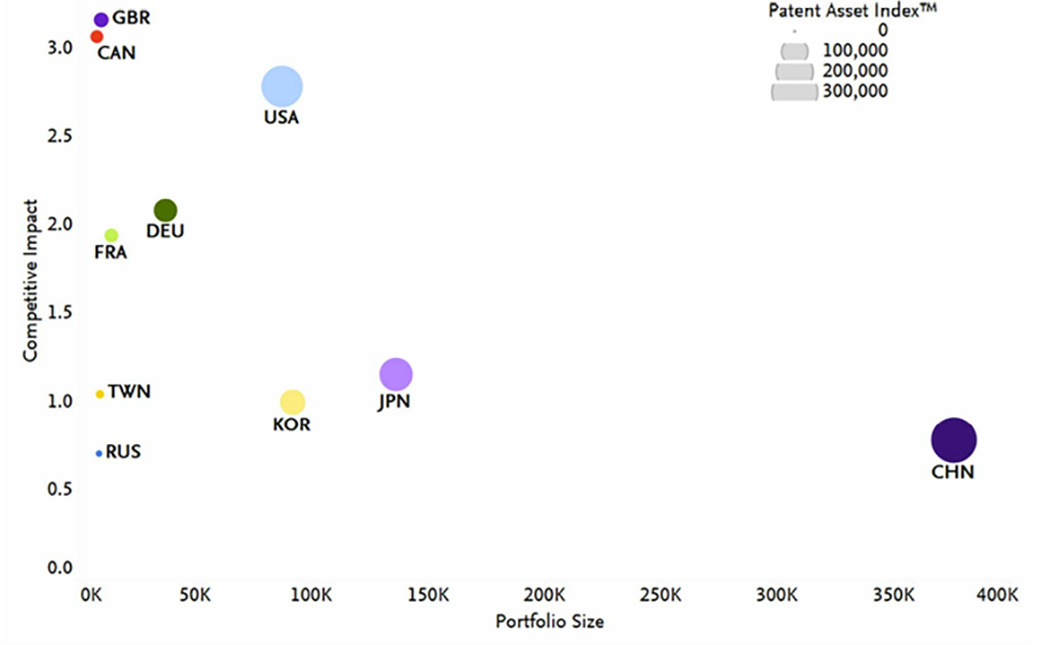
However, 320,000 of China’s 362,000 patents in 2020 were active only in its national market and not globally. China has by far the largest portfolio but its value is less than that of other leading inventor countries and regions, the report says.

Portfolio size and competitive impact of net zero energy active patents for the top 10 countries and regions by portfolio size, 2020. Size of the bubbles indicates the patent asset index. Data from LexisNexis PatentSight


 A unique international forum for public research organisations and companies to connect their external engagement with strategic interests around their R&D system.